The Power Behind the Badge — Community Education Tools + Community Teach-In Mini Series
Explore This Page
Community Teach-In Mini Series | Community Education Tools
Community Teach-In Mini-Series
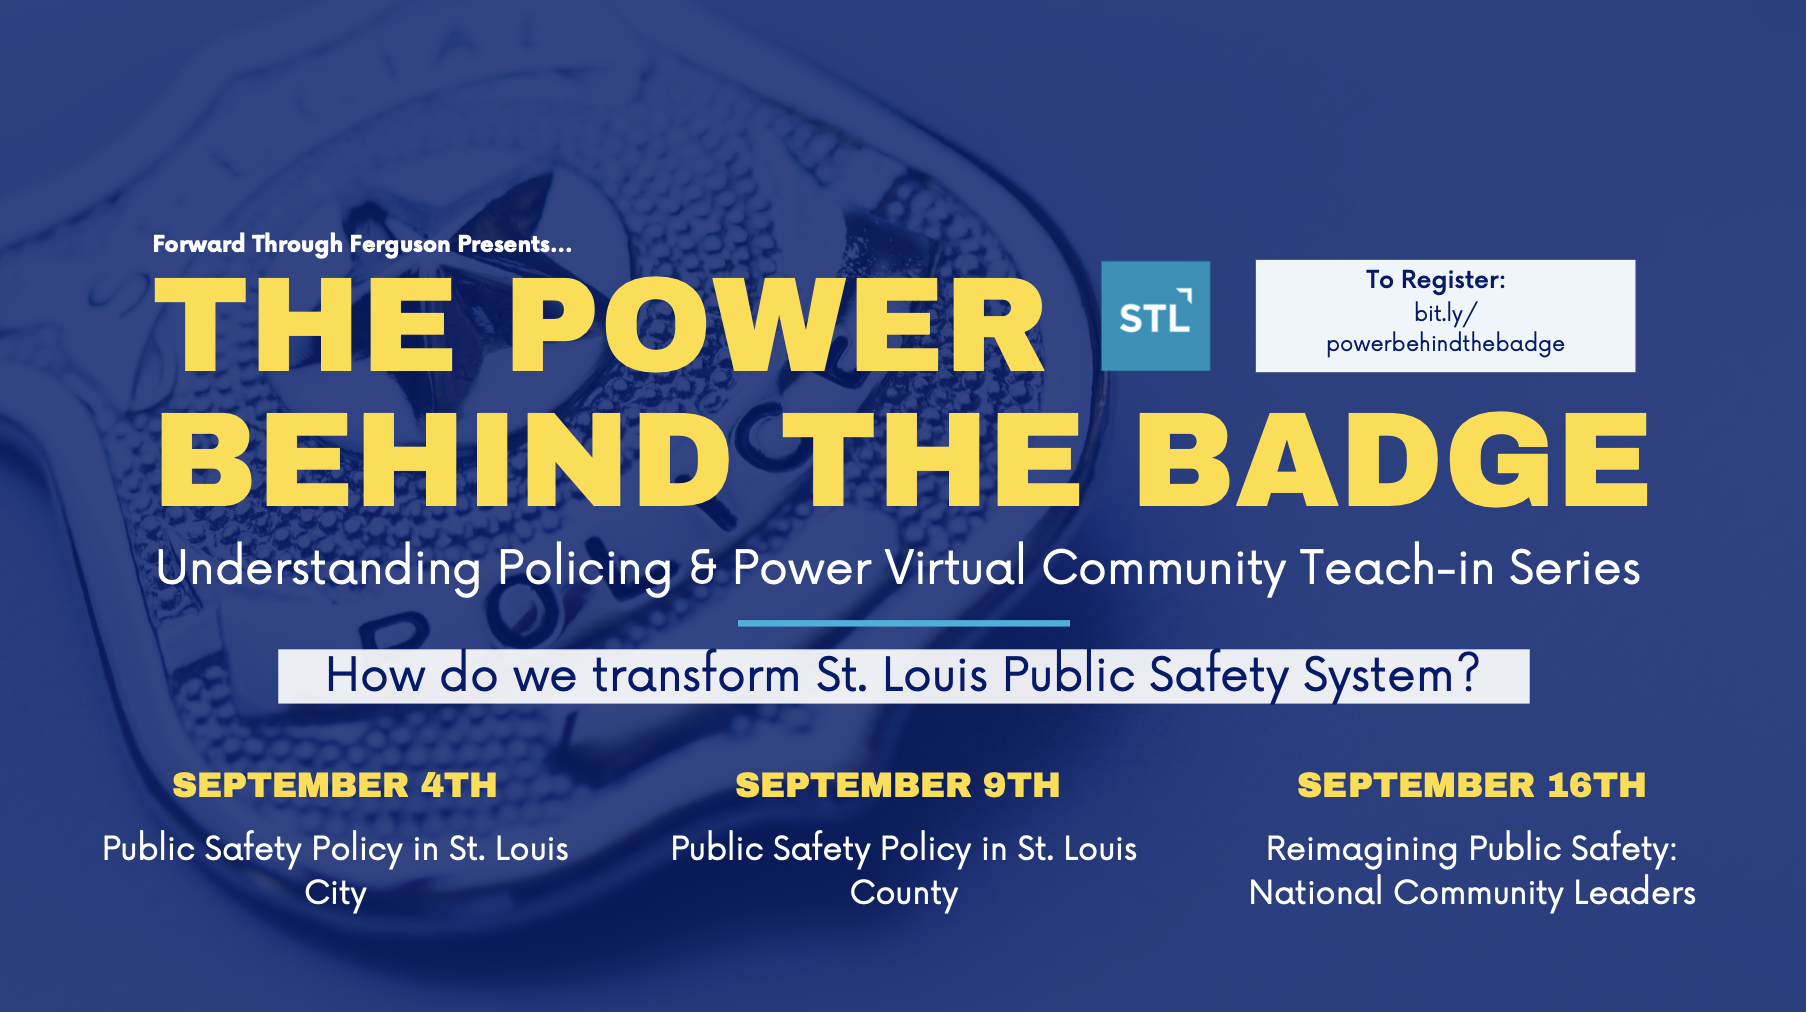
Watch the recordings here: bit.ly/powerbehindthebadge
More and more St. Louisans are demanding a transformed public safety system that moves away from the reactive arrest-and-incarcerate model to a system that invests in community members’ opportunity to thrive. This Community Teach-In mini-series will be focused on the people, policies, and processes that influence how both St. Louis City and St. Louis County’s police departments are funded and operated. We believe that residents have a right to know how decisions regarding policing and public safety are made in the region.
In this series, we will discuss the City and County police budget, go through power and process maps, have discussions about non-police first responders alternatives, and more.
If you want a St. Louis that is safe for ALL is residents, please attend!
Justice for All — Community Education Tools
The Power Behind the Badge mini-series coincides with the release of community accountability tools that residents can use to introduce and educate themselves about public safety budgets, policies, and practices as well as the decision-makers that shape police departments. Please view them below!
Budget Statistics | Police Incidents Timeline | Power, Decision, & Process Maps
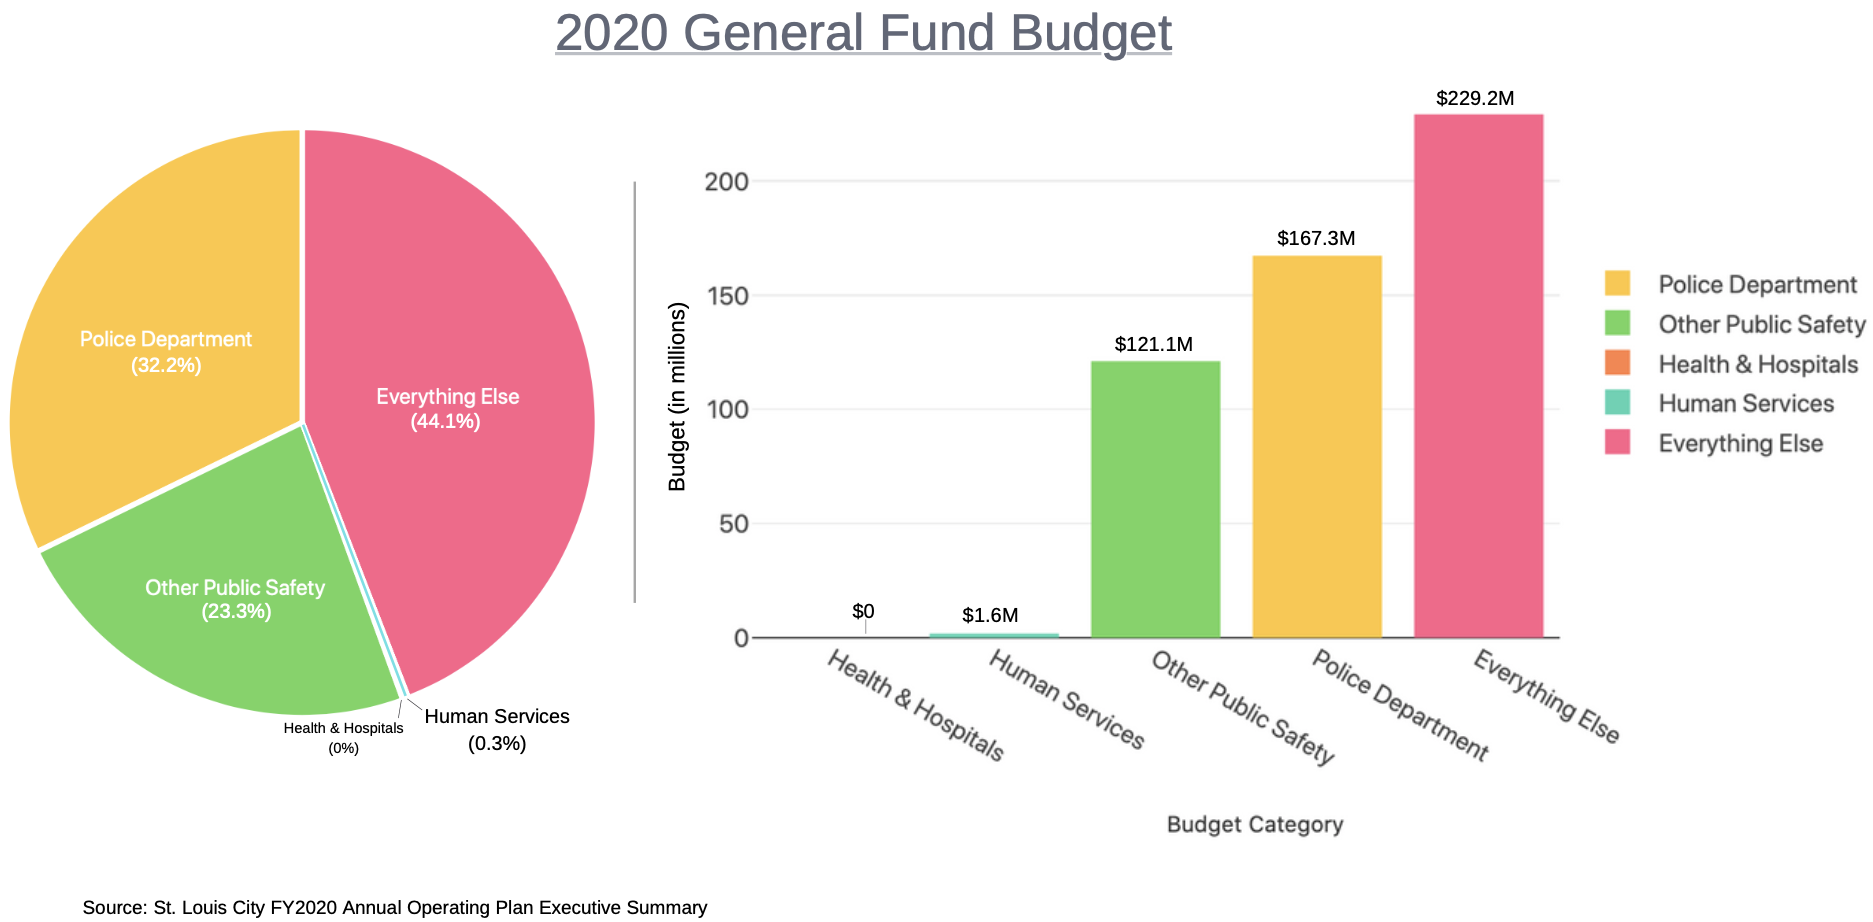
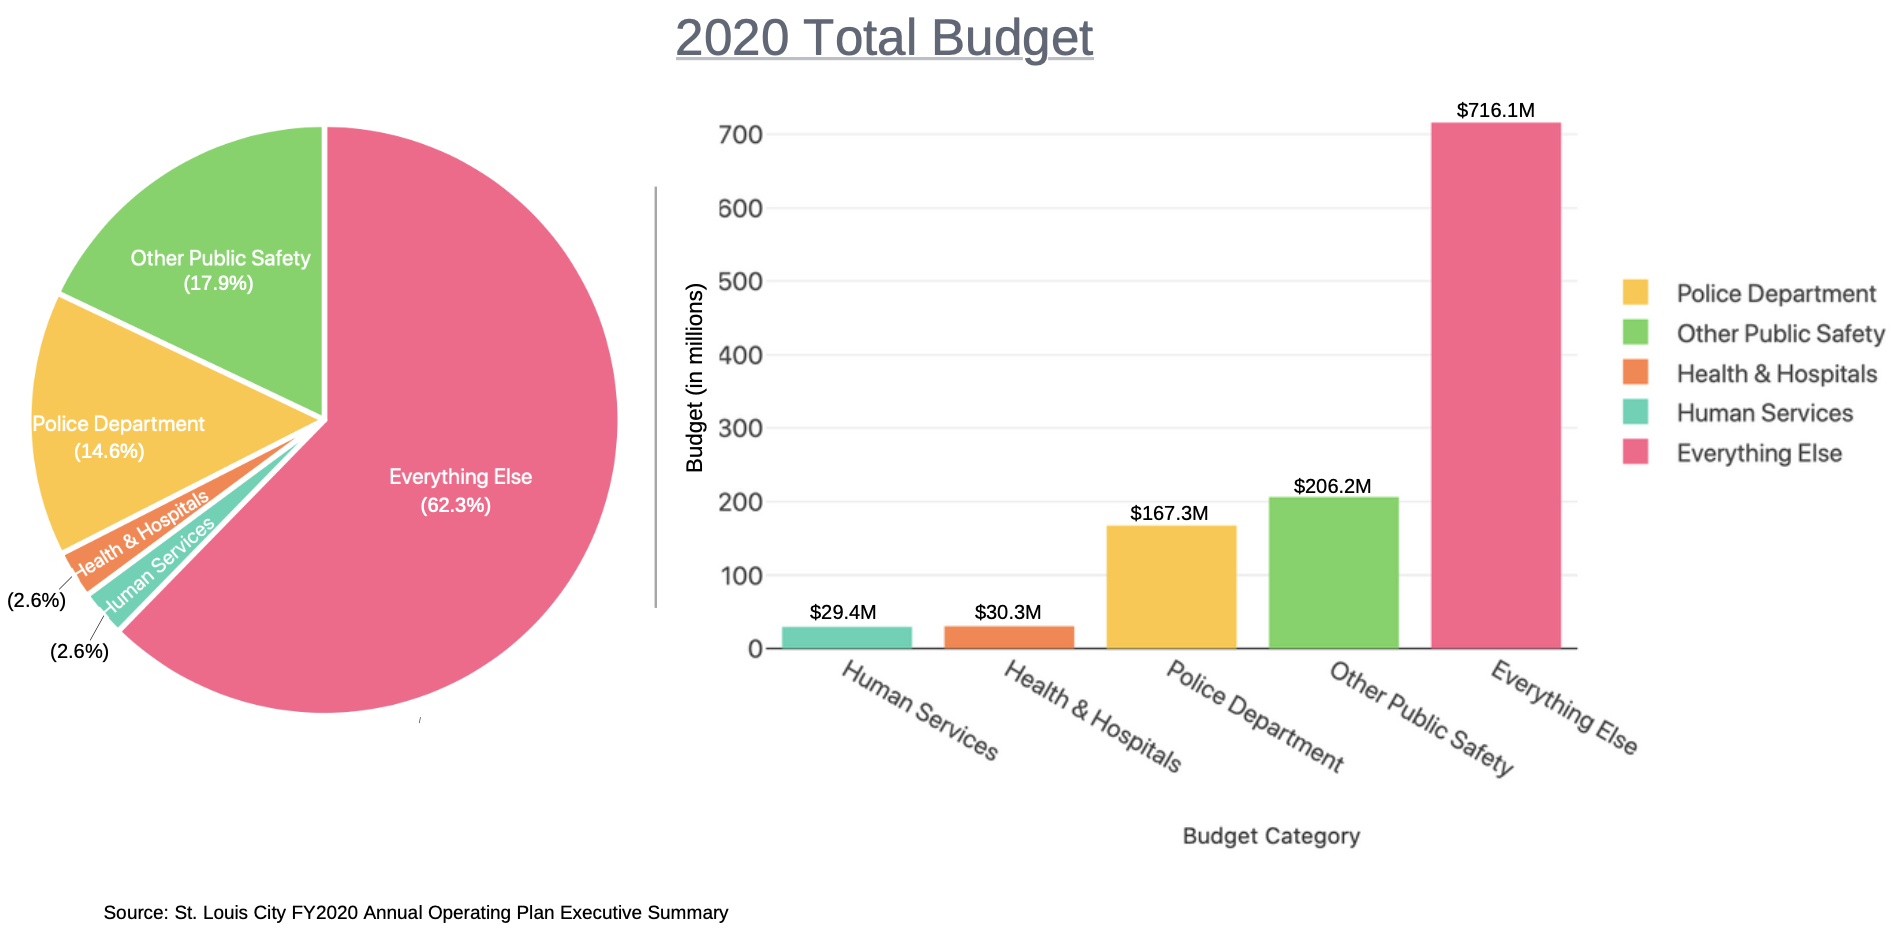
Budget Statistics
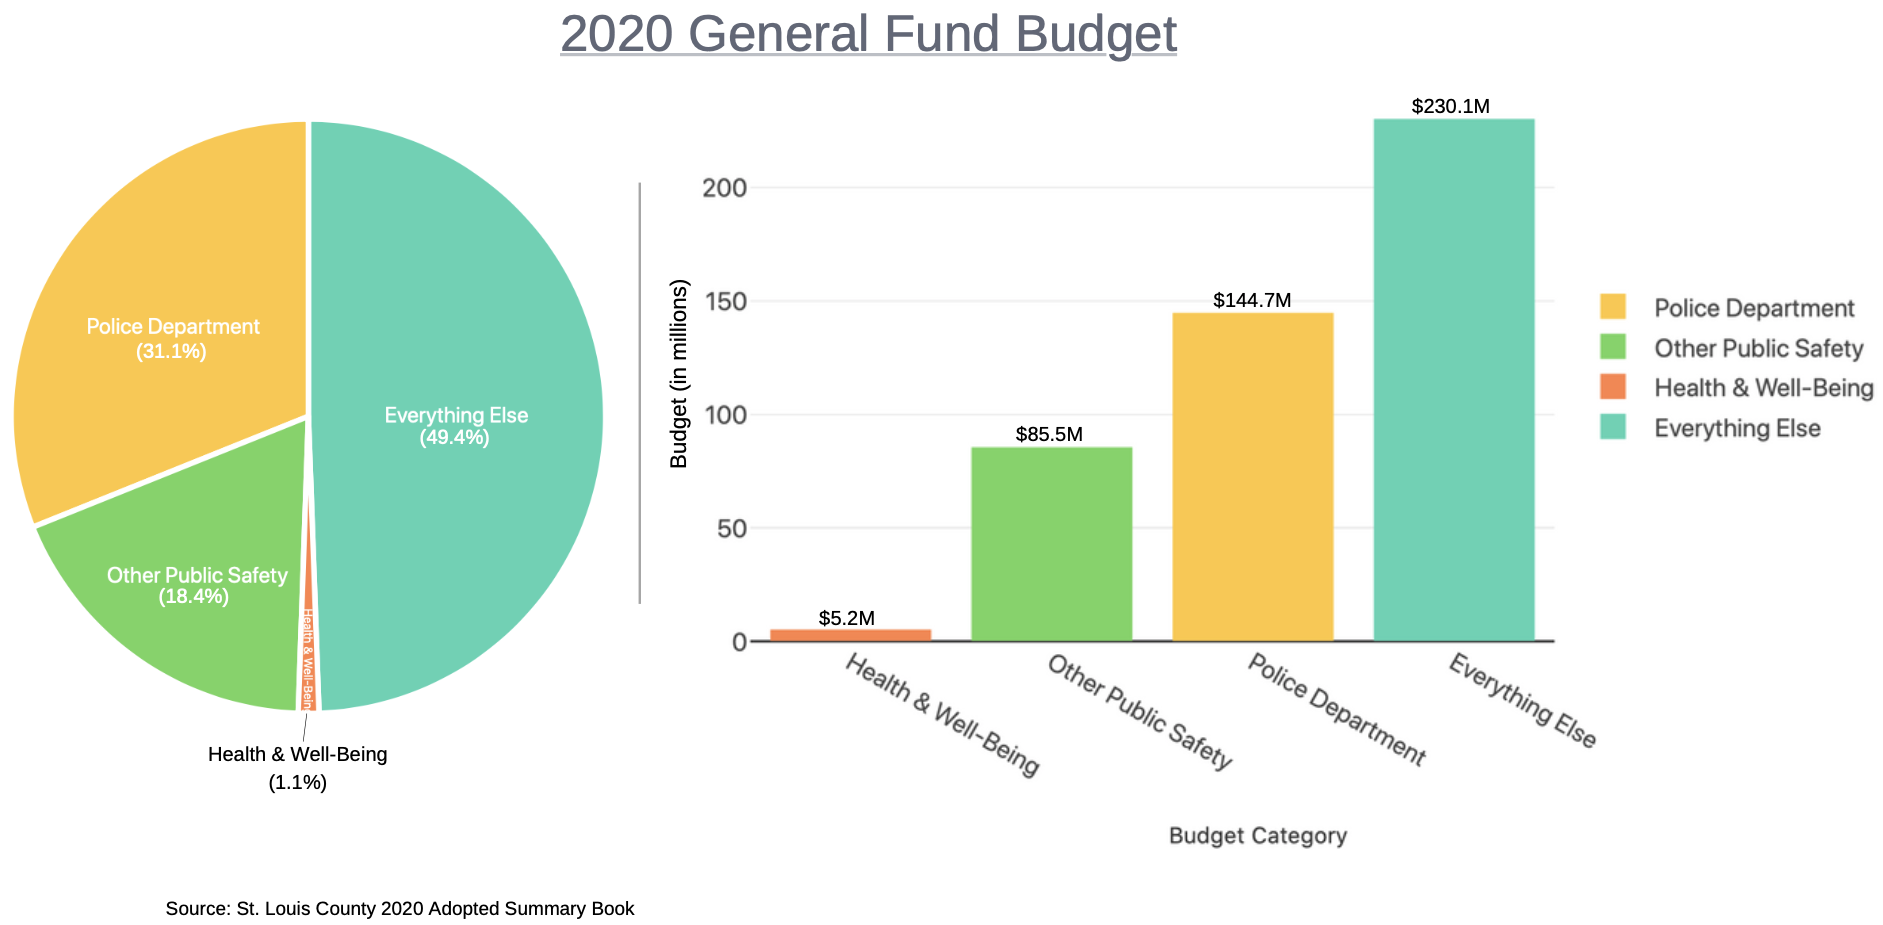
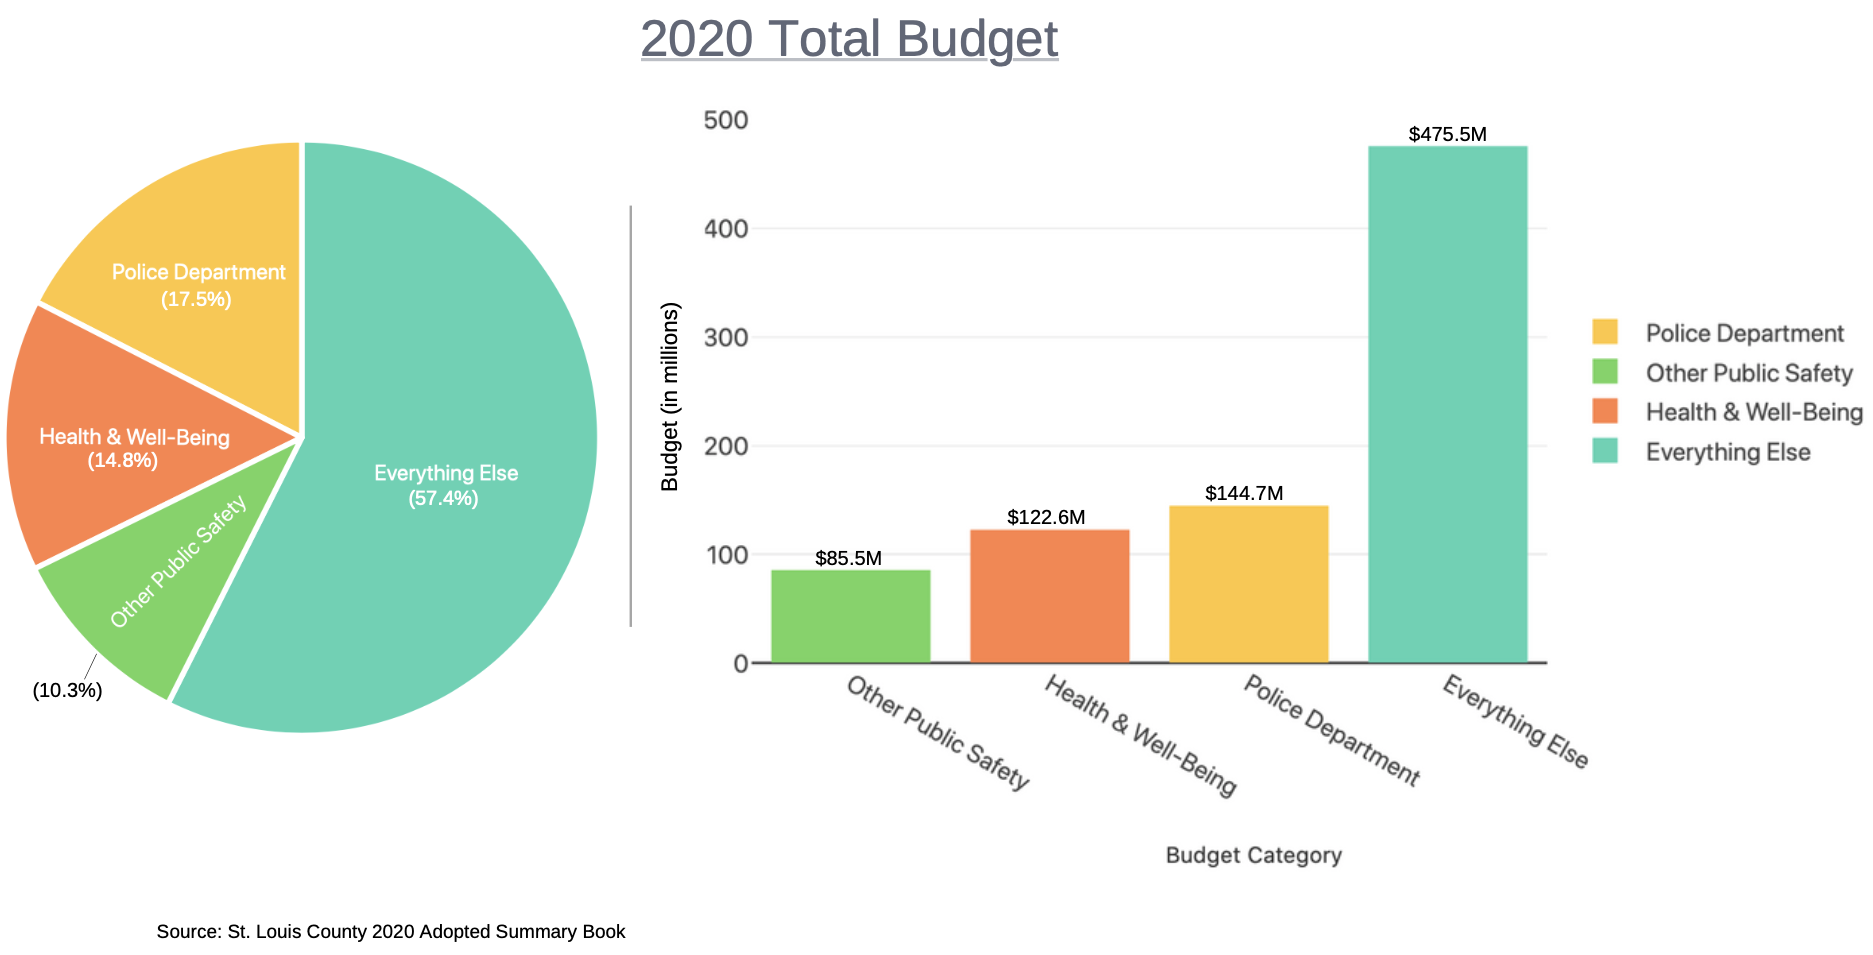
These visuals show St. Louis City and County’s budget. You will find how much money was spent on police & public safety compared to health, hospitals, & human services.
St. Louis City
St. Louis County
Full Tool Link:
The full tool includes City and County budget statistics from 2014 to 2021. You will find the specific amounts in a spreadsheet and visuals showing how each category has been funded over time. You can access the tools by clicking the link below. Please refer to the “How-to Guide + Notes” on the right to learn how to use and view the tool.
Police Incidents Timeline (2017 – present)
In alignment with the list of 5 Demands recently released by the St. Louis Organizing Table and other Justice For All policy priorities, we have put together a timeline of police incidents over the last 4 years that could have been prevented or avoided if certain policies/interventions were enacted.
Please click on the “Interactive Timeline” link above to access.
Back to top of Tools
Power, Decision, & Process Maps
These maps show the people, policies, and processes that influence policing in St. Louis City + County.
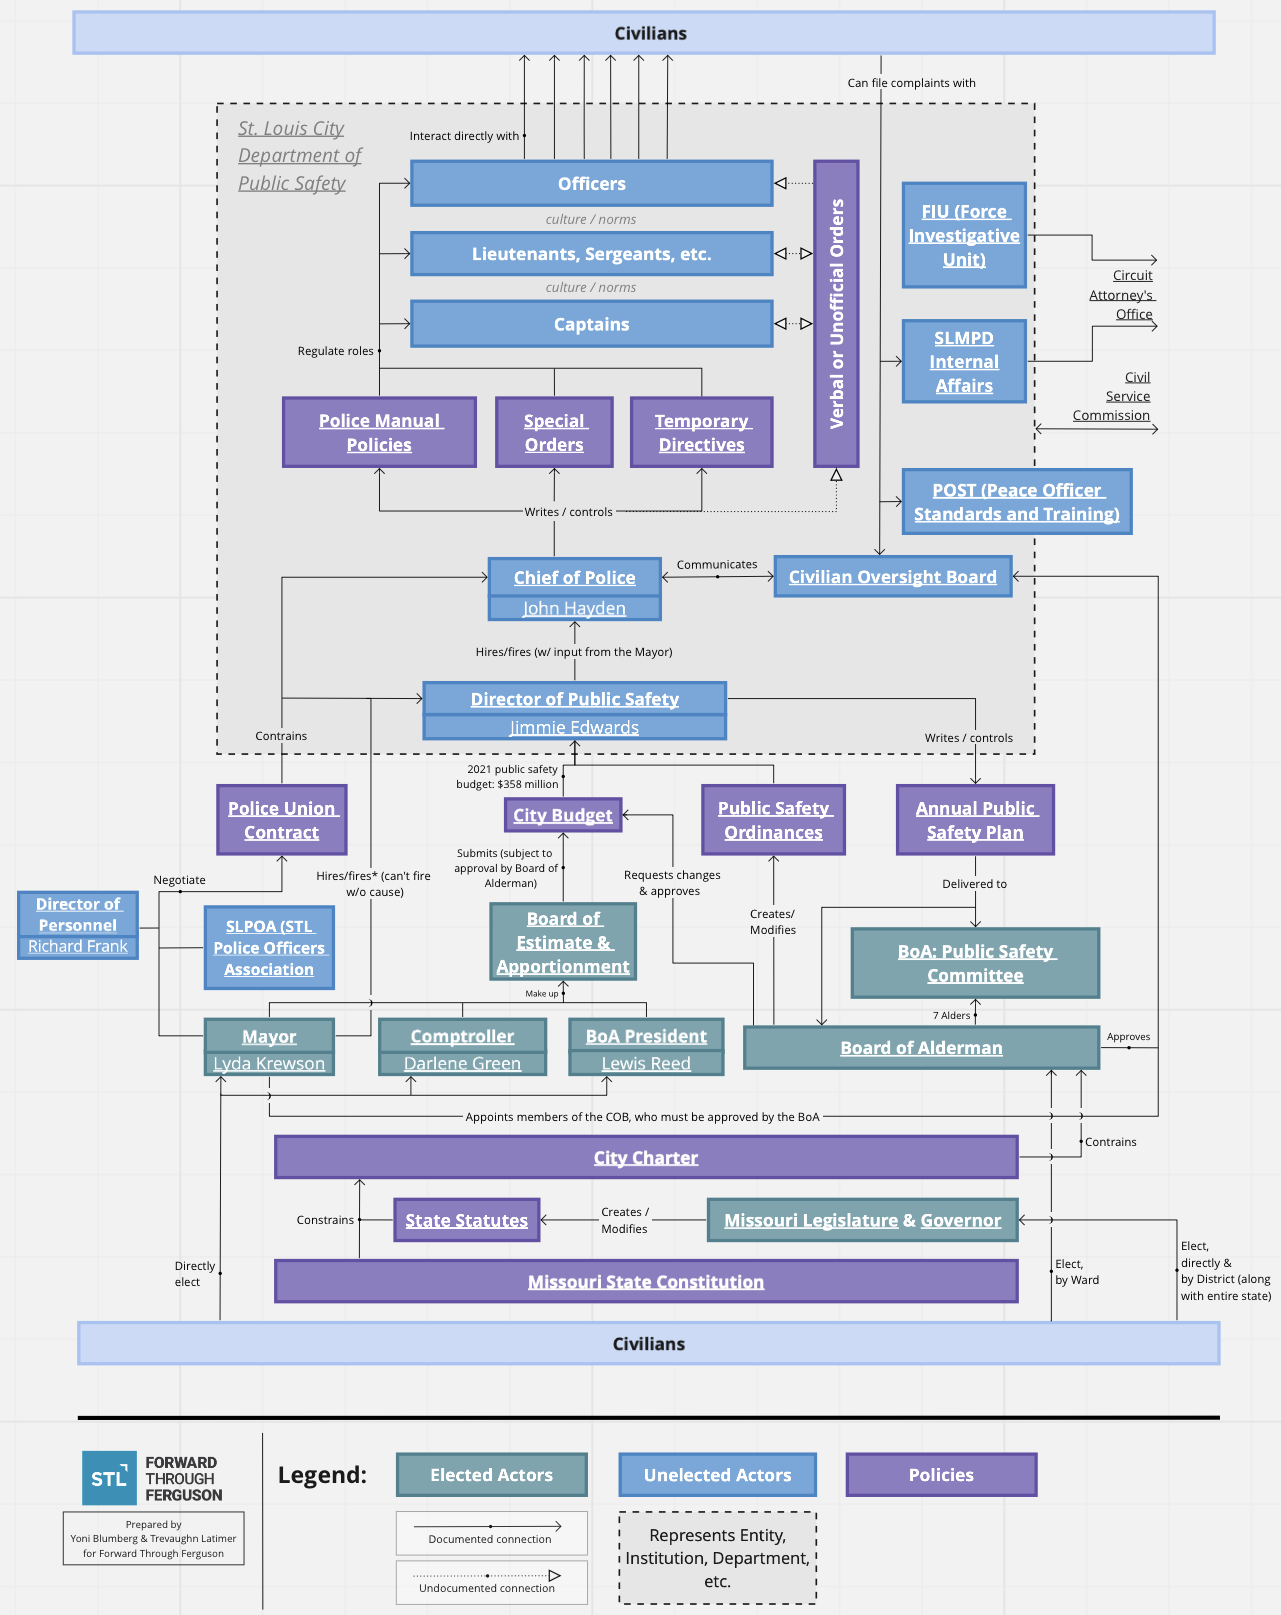
Who Controls Policing in the City of St. Louis?
Purpose: Provide an overall mapping of the governmental and political bodies that have formal power over policing in St. Louis City and the formal levers of power that they control.
The full interactive tool allows you to click on the elected actors, unelected actors, and policies that are underlined to gain more information about them. You can also zoom in and out. Click the “Interactive Tool” link above to access.
How to view:
- Refer to the legend to see the different actors highlighted in this process map.
- To see how elected officials influence public safety locate the green boxes and follow the lines associated with them. (For example, locate the green “Mayor” box to see who the current mayor is and the arrows associated with their box. You will find that the mayor helps negotiate the police union contract. Follow the other lines to see the mayor’s other influences.)
- To see how unelected officials influence public safety locate the blue boxes and follow the arrows associated with them.
- All the purple boxes are policies that are either created or managed by the elected and unelected actors.
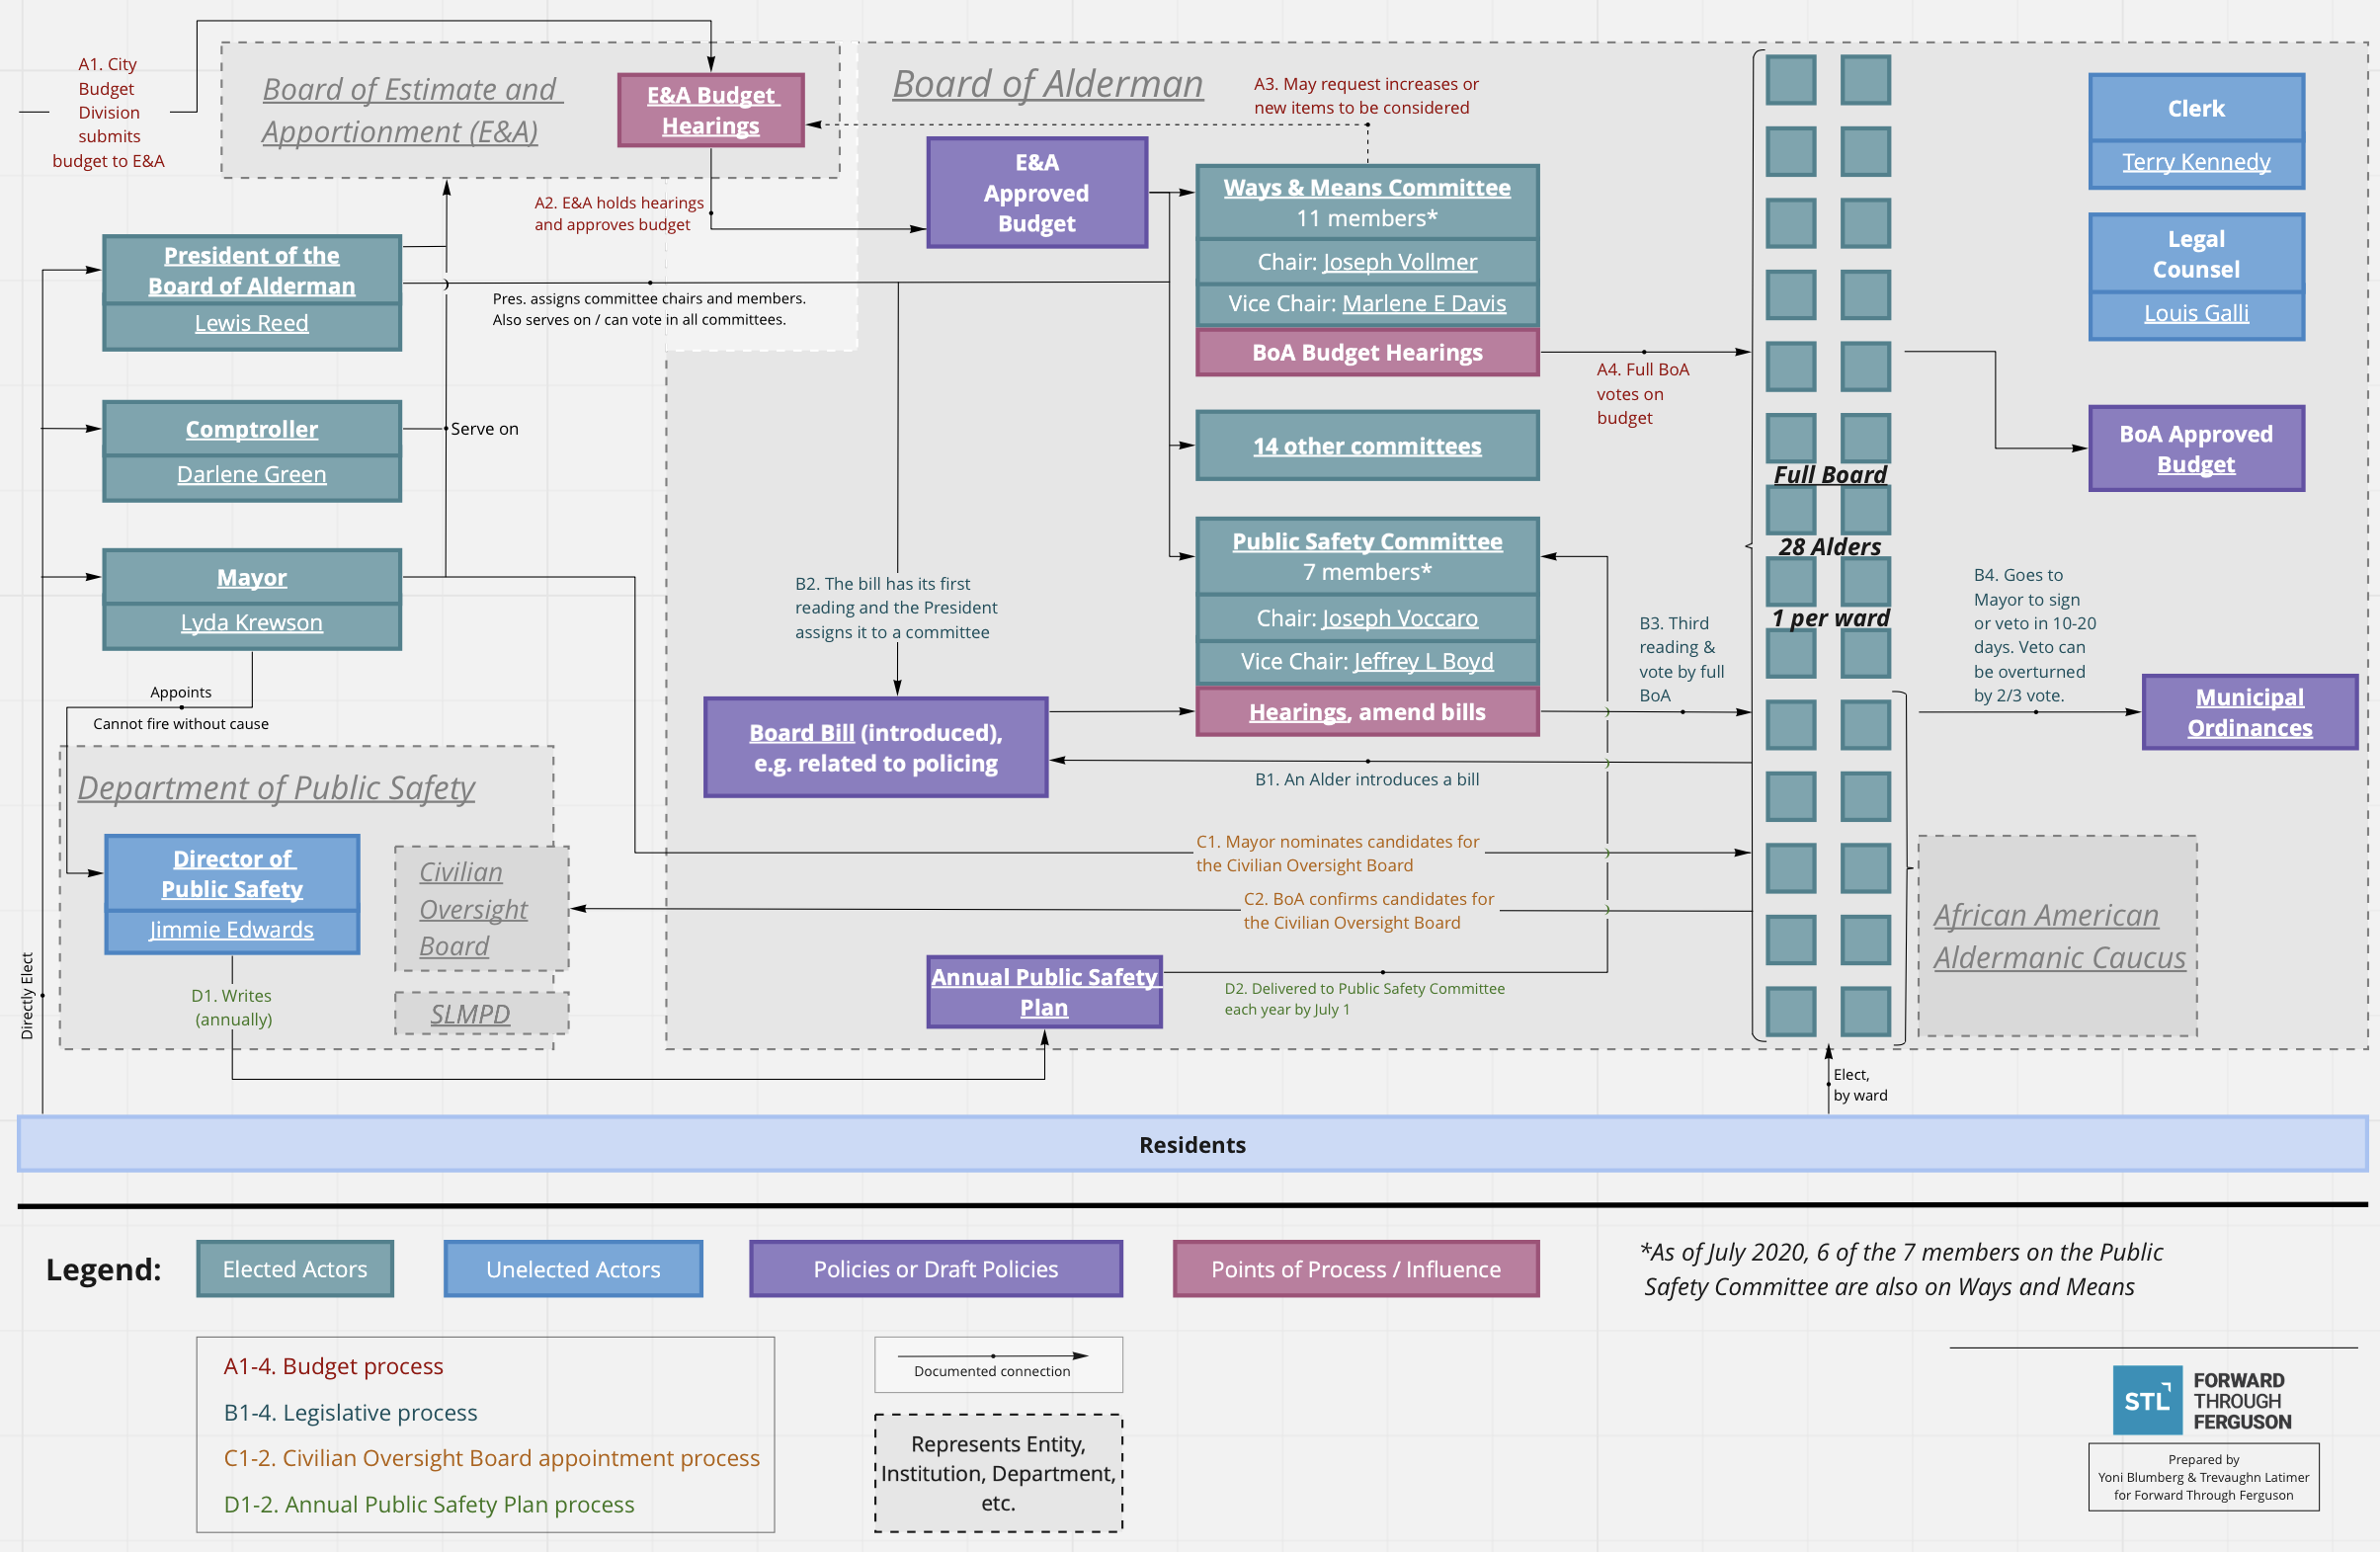
City of St. Louis Board of Alderman: Power and Process Map
Purpose: Provide a closer look at the internal structure, leaders, and levers of the St. Louis City Board of Alderman and the governmental bodies they interact with.
The full interactive tool allows you to click on the elected actors, unelected actors, and policies that are underlined to gain more information about them. You can also zoom in and out. Click the “Interactive Tool” link above to access.
How to view:
- Zoom in to see all the details.
- Refer to the legend to see the different actors highlighted in this process map.
- To see how elected officials influence public safety locate the green boxes and follow the lines associated with them. (For example, locate the green “Mayor” box to see who the current mayor is and the arrows associated with their box. You will find that the mayor nominates candidates for the Civilian Oversight Board. Follow the other lines to see the mayor’s other influences.)
- To see how unelected officials influence public safety locate the blue boxes and follow the arrows associated with them.
- All the purple boxes are policies that are either created or managed by the elected and unelected actors.
- All the red boxes are points associated with a governmental process.
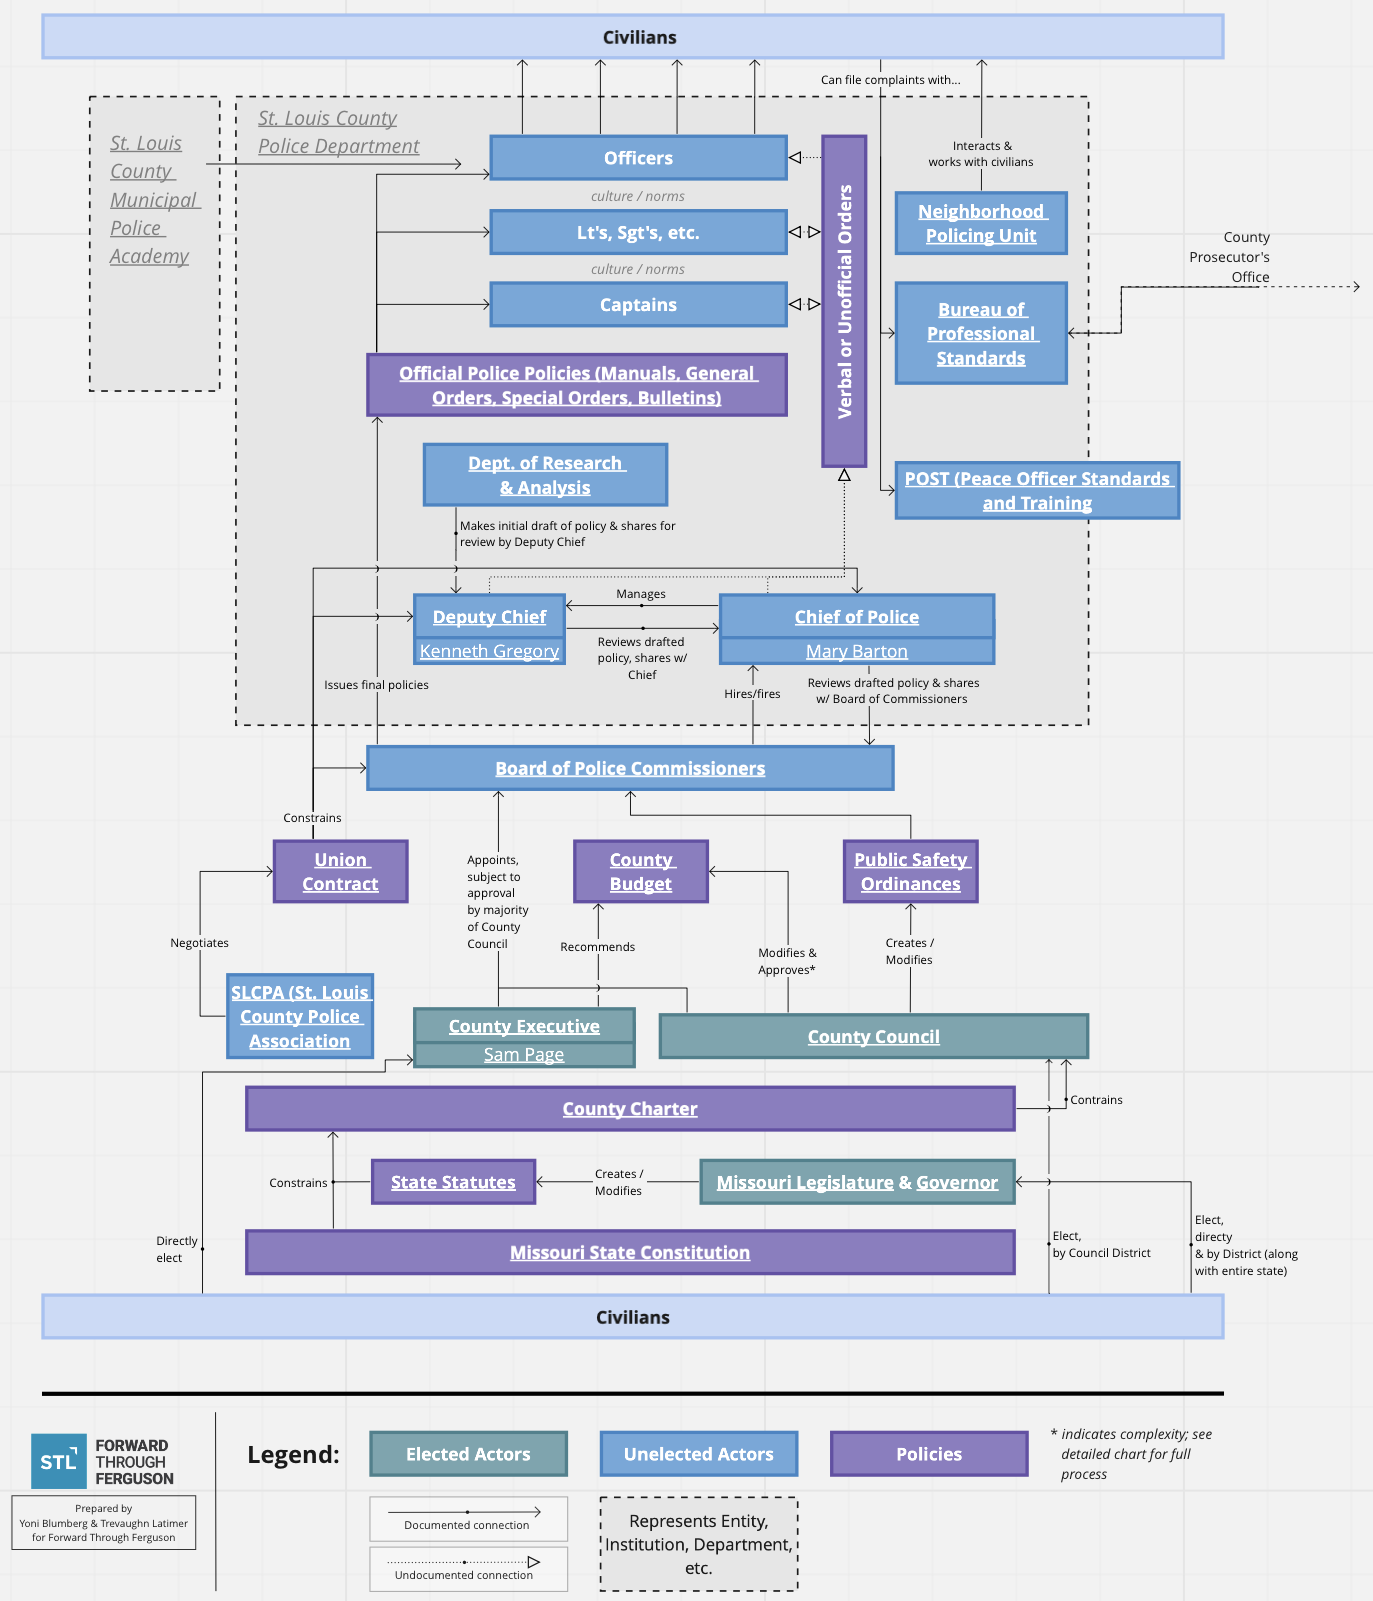
Who Controls Policing in St. Louis County?
Purpose: Provide an overall mapping of the governmental and political bodies that have formal power over policing in St. Louis County and the formal levers of power that they control.
The full interactive tool allows you to click on the elected actors, unelected actors, and policies that are underlined to gain more information about them. You can also zoom in and out. Click the “Interactive Tool” link above to access.
How to view:
- Refer to the legend to see the different actors highlighted in this process map.
- To see how elected officials influence public safety locate the green boxes and follow the lines associated with them. (For example, locate the green “County Executive” box to see who the current county executive is and the arrows associated with their box. You will find that the county executive makes recommendations to the County Budget. Follow the other lines to see the county executive’s other influences.)
- To see how unelected officials influence public safety locate the blue boxes and follow the arrows associated with them.
- All the purple boxes are policies that are either created or managed by the elected and unelected actors.